How To Refine Your Polars and Sail Charts
The phone rings with an incoming WhatsApp call from Stuart Bannatyne. I’m at my desk at Google, so I jog to a conference room to have a private conversation. Bannatyne, from Doyle Sails, is a legend in the sailing world—and that’s no hyperbole. When it comes to leading successful grand-prix race programs, there’s nobody better. He cuts straight to the chase: “Lewy, you interested in going racing?”
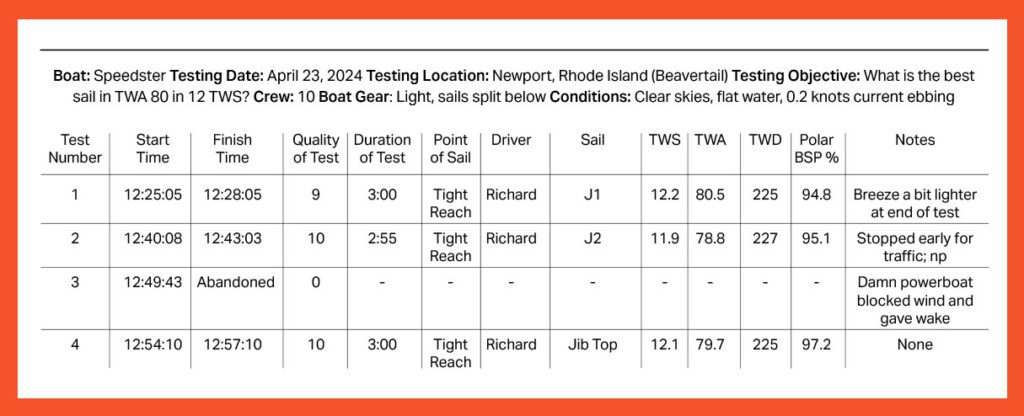 A sample chart of a sail inventory test with the objective of determining which headsail is best at a true-wind angle of 80 degrees at 12 knots true-wind speed.
“Yeah, Stu,” I answer. “Always interested to hear what you have on the boil.”
He’s got a new program shaping up for the 2024 Newport Bermuda Race, a TP52 named Summer Storm, a boat with a solid winning record and a new owner in Andrew Berdon. My excitement is building, but I keep my cool while mentally running through the checklist of elements needed for a successful program.
My next questions are about the sails and the crew. Bannatyne rattles off from memory every sail that the boat will come with and what new sails we will need to be competitive. The crew are not only top-shelf sailors, but most of them won line honors and the corrected win in the Gibbs Hill Division with us in the previous Bermuda Race (Richard Clarke, Mal Parker, Chris Welch, Dylan Vogel and David Gilmour) as well. That’s all I need to hear, and I give Bannatyne an emphatic “I’m in!”
A few days later, a FedEx package arrives at my door from boat captain Alec Snyder, and my daughter asks, “What’s in it?”
“It’s a present from the new boat,” I tell her.
“Is it a puppy?” she asks.
“No—it’s even better. It’s the boat’s computer, and now I can start digging into the polars and sail charts.”
We all know that polars and sail charts matter. That’s why we have them laminated and mounted in the cockpit of our race boat. One chart tells us our target speeds and angles (which are derived from polars), and the other tells us which sails we should have up.
Understanding these two crucial pieces of information can be the difference between a podium finish and a participation award. We’ve been using them for a long time, and much has been written about how to use them, but today the importance of understanding a boat’s polars has added significance with the adoption of the new Forecast Time Correction Factor rating system.
Iconic ocean races such as the Transpac and the Bermuda Race recently announced that they will use the new F-TCF system to calculate race results, which will rely on meticulously calculated polars using a velocity-prediction program. This new scoring adaptation underscores the necessity for skippers and crews to have an even deeper grasp of their boat’s sail plan and polars. No matter what boat you’re racing this year or next, your first priority in preparation should be refining your polars and sail charts.
Digging for OilMy technologist neighbors in Silicon Valley celebrate the principle that “data is the new oil,” and this is true in sailing as well. Nowadays, it’s easy to collect treasure troves of data from every sensor on the boat. With the powerful navigation tools at our disposal, it’s easier than ever to take our polars, which forecast a boat’s performance at every wind angle and every wind strength, and crunch them with accurate weather files and racecourse mark information to produce optimal routing. We can also repeat polars to our displays, in real-time, with target speed and angles as well as polar boatspeed percentages. With this level of functionality accessible to virtually every boat, it’s fair to say that polars are more important than ever.
Gone are the days where a professional sailor could eyeball a headsail and make some profound-sounding recommendation that no one could challenge because of their years of experience and enviable track record (even if the comment was just an assertive hunch). With today’s tools, BS is replaced with real science. Remember the scientific method you learned in high school? It still matters, and we now have the tools to confidently test whether A is faster than B. Unsure whether the J1, J2 or jib top would be faster at a deeper true-wind angle? Well, test it. That’s science, sailing’s new “moneyball,” which translates into speed.
Granted, while all this new science might be easy for top-end navigators, it can be daunting for amateur programs to take a data-based approach to performance improvement. But it’s absolutely possible. The crux of sailing moneyball is to make use of your log files and process them into analyzable and actionable data. Thankfully, Expedition—the gold standard of navigational software—has this functionality built in, and so do other analytics platforms. Without the tools to notate and process log data, all you have is a pile of files on memory sticks, which do you no good. If you want oil, you have to go digging.
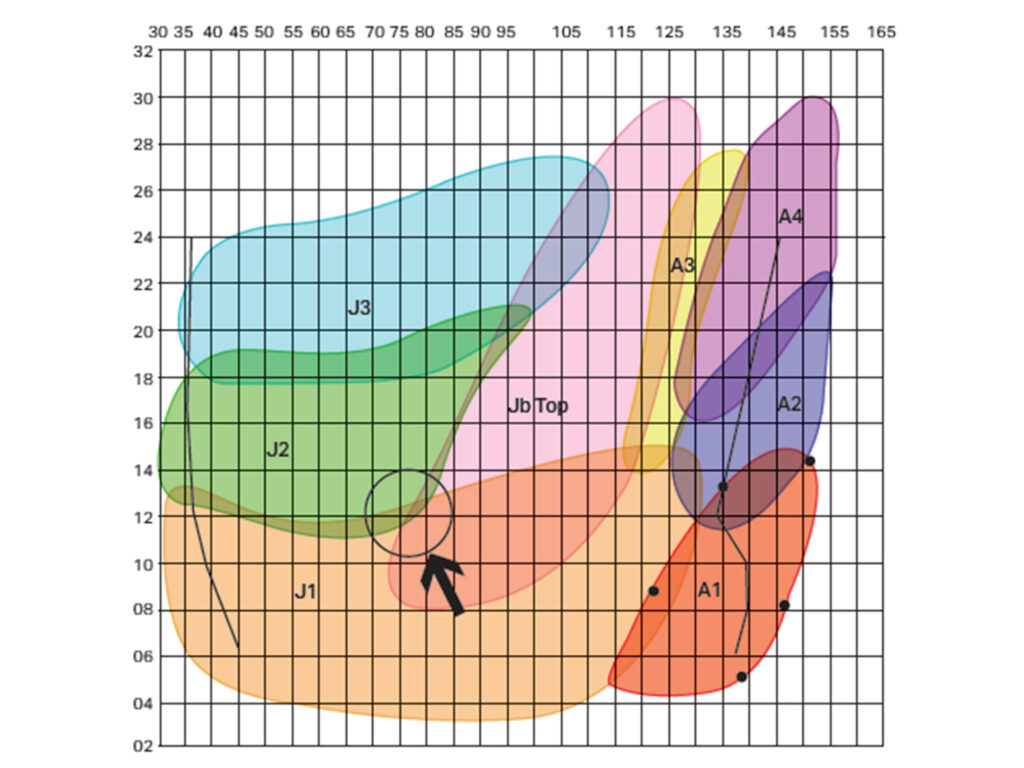 On this hypothetical sail chart, the intersection of three different sails (circled) is a great place to test. After testing (see the detailed table above), you could then re-create the sail chart to show that the jib-top headsail (light red) is the clear winner in the cell for 12 knots of true-wind speed at 80 degrees true-wind angle.
Courtesy Christopher Lewis
On this hypothetical sail chart, the intersection of three different sails (circled) is a great place to test. After testing (see the detailed table above), you could then re-create the sail chart to show that the jib-top headsail (light red) is the clear winner in the cell for 12 knots of true-wind speed at 80 degrees true-wind angle.
Courtesy Christopher Lewis
Once you have the ability to analyze your data (and there are plenty of webinars and seminars to get you there), the next big hurdle is determining your data quality or data hygiene. In this category, the first two considerations are instrument calibration and data labeling. Instrument calibration is probably the most obvious.
Science demands that if you are comparing boatspeeds, then your boatspeed calibration needs to be spot-on for both. That’s also true of your wind calibration. You can’t compare apples, oranges and ducks. Data labeling is not obvious at first, but there are fundamental best practices: keeping track of when you were racing and when you were just motoring around between races (imagine how good your light-wind polars would look if you had your iron jib helping); logging which sails you had up and when; and keeping accurate real-time notes, like when you might be in the sweet spot of a sail, for example. You have to be meticulous and disciplined with your data-collection practices, even while you are doing your primary sailing jobs. Make it a priority.
A few examples of next-level considerations would be noting wind shear (which is especially noticeable on cold mornings where there’s 8 knots at the masthead and nothing on water), boat weight and balance (don’t compare numbers with a laden boat prepared to go to Hawaii versus a light boat set up for daysailing), and variables such as who was driving and when. Good science is about eliminating variables so that you see the signal, not the noise.
Speed Is in the PercentageMy personal catchphrase is “speed is all about finding 2 percent” (even though it could be a bigger or smaller percentage). Imagine a beautiful sunny day where you have flat seas and 12 knots of well-mixed wind. On such a day, we’ll have a wish list of things we want tested, and high on the priority list might be the edges of a sail’s coverage. For example, how deep can we sail on the J1 or J2 before performance percentages plummet versus how high can we sail a reaching sail?
In order to find out, we sail in the same direction with the J1 at 80 degrees true-wind angle for 3 minutes. Then, we drop the sail and continue with the J2 at exactly the same true-wind angle for the same 3 minutes. Finally, we do the same with the jib top. Assuming that the wind conditions don’t change during this window, each test will produce a polar boatspeed percentage; imagine the results are that the jib top is 97.2 percent, the J2 is 95.1 percent, and the J1 is 94.8 percent. We have the answer of which is faster in exactly those conditions and we found our 2 percent.
Once decisions are made about which sails to bring for the race, you also have to figure out the best ways to fill any gaps in your sail plan with other sails you are taking.
The reality, however, is that not all of your tests will be perfect, so scientific excellence would dictate that you’ll want more testing data points to prove any conclusion by repeatability. Once you’ve successfully proved something, you can nudge the potato shape of the sail chart to implement what you’ve learned. Now imagine doing that for every square of your sail-chart grid by building out an entire database of carefully curated data points from racing and testing conditions. You’d be 2 percent faster all the time and you’d be able to dial-in polars with high quality data. It burns me up to imagine that during a race, I might be sailing 2 percent slower for hours by having the wrong sail up in a distance race.
The reality is that even the most sophisticated grand-prix programs can’t test everything, so apply judgment to your own resources and prioritizing tests for what matters most. The same methodologies can be used to test anything—rake settings, staysails, rudder, outrigger, water ballast, etc. The list is limited only by your curiosity.
Pre-race Sail OptimizationWhile much has been written about how polars and sail charts are used while you are racing, they also play an important role before crossing the starting line, or even before locking in your rating certificate. While your boat weight and design might not change much, your declared sail selection can have a significant impact on your polars. The first step in optimizing your sail quiver is typically consulting your sailmaker, but if you want to level up, there are consultants who can help run and analyze trial certificates to help find advantages.
Sail optimization is essentially the science of trying to find ideal sail combinations for the course and your particular boat—combinations that allow you to sail faster than the rating agency’s VPP predicts you can. Said differently (and perhaps more traditionally), you are looking for sail combinations that are favored, or have a sweet spot under a rule, while avoiding sails that are punished disproportionately.
I like to look at the delta in each cell of the polar table to see how a particular sail will change the predicted polar speed. Then the game is to decide whether actual performance exceeds or misses the predicted changes, so you can then decide whether a particular sail is worthwhile from a ratings perspective.
Once decisions are made about which sails to bring for the race, you also have to figure out the best ways to fill any gaps in your sail plan with other sails you are taking. Of course, the best way to do that is sail testing, using the very same methodologies previously discussed to determine the answer to each question with cold, hard data instead of speculation.
Whether you’re racing for a local trophy or tackling an iconic offshore challenge, understanding polars and sail charts is the key to achieving the highest level of performance in which your boat is capable. Trophies are there for the taking for those with insatiable curiosity for unlocking the secrets to speed in their boats.
The post How To Refine Your Polars and Sail Charts appeared first on Sailing World.